Client Overview
Website: magnetenkopen.nl
Industry: E-commerce (industrial and consumer magnets)
Platform: WordPress + WooCommerce + Bricks Builder
Scale: ~400 product SKUs across multiple categories (neodymium, ceramic, rubber, pot magnets, and magnetic systems)
Region: Netherlands (Dutch-language store)
The Problem
When we were brought in, magnetenkopen.nl was failing Google’s Core Web Vitals assessment across both mobile and desktop. Google Search Console flagged two critical issues:
- LCP (Largest Contentful Paint) exceeding 4 seconds on desktop — rated “Poor”
- CLS (Cumulative Layout Shift) exceeding 0.1 on desktop — rated “Needs Improvement”
- TTFB (Time to First Byte)
For an e-commerce site competing in a niche B2B/B2C market, this meant a direct ranking disadvantage. Google uses CWV as a ranking signal, and with 126 indexed URLs all failing, the organic visibility impact was measurable.
Baseline Audit Findings
Our initial technical audit uncovered a textbook case of plugin and third-party bloat on an underpowered hosting stack:
| Metric | Before (Baseline) | Google Threshold | Status |
|---|---|---|---|
| LCP (Desktop) | >4.0 s | ≤2.5 s | Poor |
| CLS (Desktop) | >0.1 | ≤0.1 | Needs Improvement |
| TTFB | 1.37–1.72 s (p75–p90) | ≤0.8 s | Poor |
| FCP | 1.45–1.66 s (p75–p90) | ≤1.8 s | Borderline |
| Total Scripts on Page | 81 | — | Excessive |
| Third-Party Scripts | 37 | — | Excessive |
| Scripts Delayable | 61 of 81 (75%) | — | Critical finding |
| Scripts Blocking First Paint | 10 | — | Critical finding |
The site was running a heavy stack: Elementor page builder, WooCommerce with extended product options, Rank Math SEO, Essential Addons, WPForms, a third-party cookie consent widget, and an external review aggregation system — each injecting its own JavaScript, CSS, and external network requests.
The hosting infrastructure added another layer of difficulty. The origin server was slow, producing TTFB values well above 1 second at the 75th percentile and approaching 1.7 seconds at the 90th percentile. The client had a firm constraint: no hosting migration. This meant we had to solve the server response time problem at the edge, not the origin.
Our Approach
The methodology was systematic, data-driven, and deliberately incremental. We avoid “performance plugin magic” — the kind of blanket caching and minification that passes lab tests but breaks real-user experiences. Instead, we follow a four-phase framework.
Phase 1: Instrumentation (Week 1)
Before changing a single line of code, we set up Real User Monitoring (RUM) through Cloudflare Web Analytics. This gave us field data — what actual visitors on actual devices were experiencing — not synthetic lab scores from a fast server in Virginia.
We configured Cloudflare’s RUM to track all three Core Web Vitals (LCP, INP, CLS) plus supporting metrics (FCP, TTFB) at the 75th, 80th, and 90th percentiles. This granularity was essential: Google evaluates CWV at the 75th percentile, but if your p90 is borderline, you’re one traffic spike away from regression.
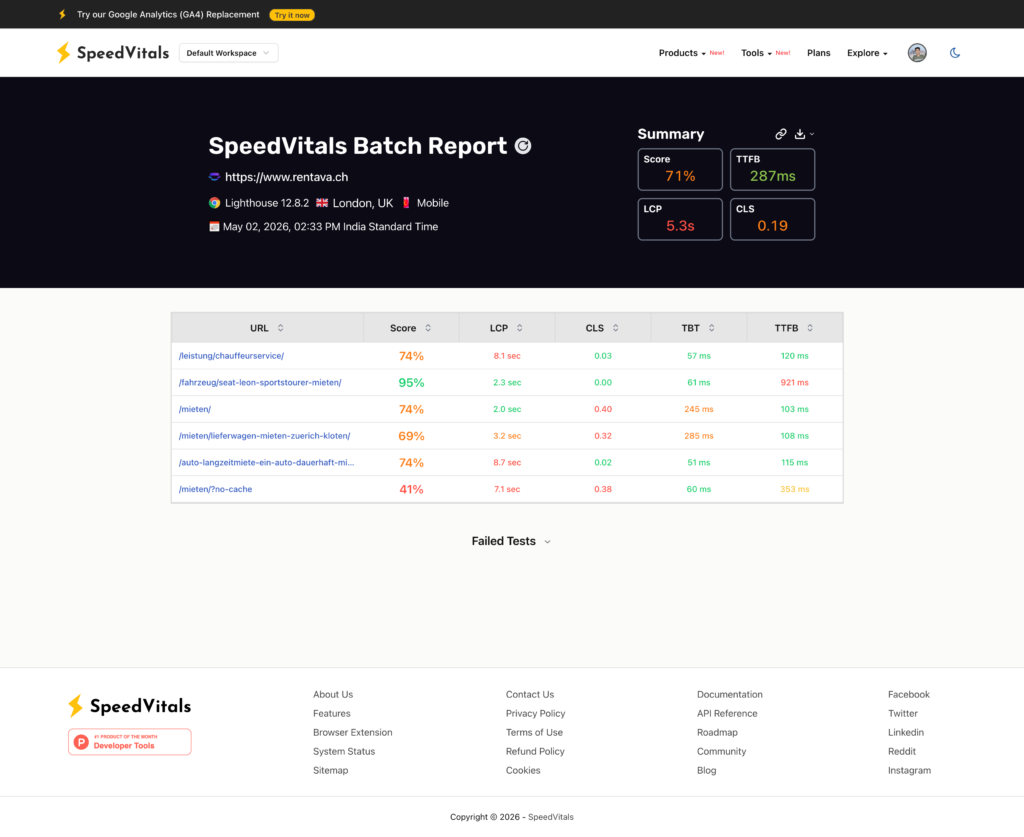
We also ran batch SpeedVitals reports across the site’s key page templates — homepage, category pages, product pages, and checkout — to identify which templates had the worst performance profiles.
Phase 2: CDN and Server Response (Week 1–2)
With TTFB as the single largest bottleneck and hosting migration off the table, we deployed Cloudflare as a full-page CDN proxy:
- Cloudflare full-site caching configured with appropriate cache rules for WooCommerce (bypassing cache for cart, checkout, and logged-in sessions)
- Edge caching for static product pages and category archives — the bulk of the 400-product catalog
- HTML caching with stale-while-revalidate to ensure returning visitors never hit the slow origin
The TTFB impact was immediate and dramatic. On one representative measurement, server response time dropped from over 1.7 seconds to under 400 milliseconds — a reduction driven entirely by serving cached HTML from Cloudflare’s edge nodes in Amsterdam, close to the Dutch user base.
Phase 3: JavaScript and Plugin Overhaul (Week 2–4)
This was the core of the work. Our script audit had identified 81 total scripts on the page, with 37 originating from third-party domains and 61 flagged as candidates for delayed loading. We attacked this from three angles:
1. Plugin Replacement
Not all plugins are created equal. Two plugins stood out as disproportionately expensive:
- Cookie Consent Widget: The existing solution loaded an external JavaScript bundle from a third-party CDN, triggered a layout shift when it rendered, and blocked interactivity. We replaced it with a locally-hosted, lightweight cookie consent plugin that loaded asynchronously and had a pre-defined layout reservation to eliminate CLS.
- Product Review System: The third-party review aggregation service injected multiple scripts, made external API calls during page load, and contributed to both LCP delay and layout instability. We migrated to a self-hosted review solution that loaded reviews from the local database with no external dependencies.
2. Script Deferral and Delay Strategy
For the remaining plugins that couldn’t be replaced, we implemented a tiered loading strategy:
- Critical path (10 scripts): Loaded normally — these were essential for above-the-fold rendering
- Deferred (non-critical): Loaded with
deferattribute — parsed after HTML but beforeDOMContentLoaded - Delayed (interaction-triggered): Loaded only after user interaction (scroll, click, tap) — this covered analytics, chat widgets, and non-essential UI enhancements
After optimization, the third-party request count dropped from 37 to 13, and total transfer size for initial page load dropped to 46.8 KB of JavaScript.
3. Render-Blocking Resource Elimination
We audited all CSS and JS that loaded before First Contentful Paint. Non-critical Elementor widget CSS was deferred. Font loading was switched to font-display: swap with preload hints for the primary typeface. Icon libraries were subset to only the glyphs actually used on the site.
Phase 4: CLS Remediation and Fine-Tuning (Week 4–6)
CLS was the most stubborn metric. Layout shifts on e-commerce sites typically come from:
- Images without explicit dimensions
- Dynamically injected banners or widgets
- Web fonts causing text reflow
- Late-loading product review stars or price badges
We addressed each source:
- Set explicit
widthandheightattributes on all product images and category thumbnails - Reserved layout space for the cookie consent banner and review widgets using CSS
min-heightplaceholders - Ensured font swap transitions were smooth with matched fallback font metrics
- Stabilized the header and navigation so promotional banners didn’t push content down on load
The RUM data guided every decision. We monitored CLS at the element level using Cloudflare’s debug view, which identified exactly which DOM elements were causing shifts and on which page templates.
Results
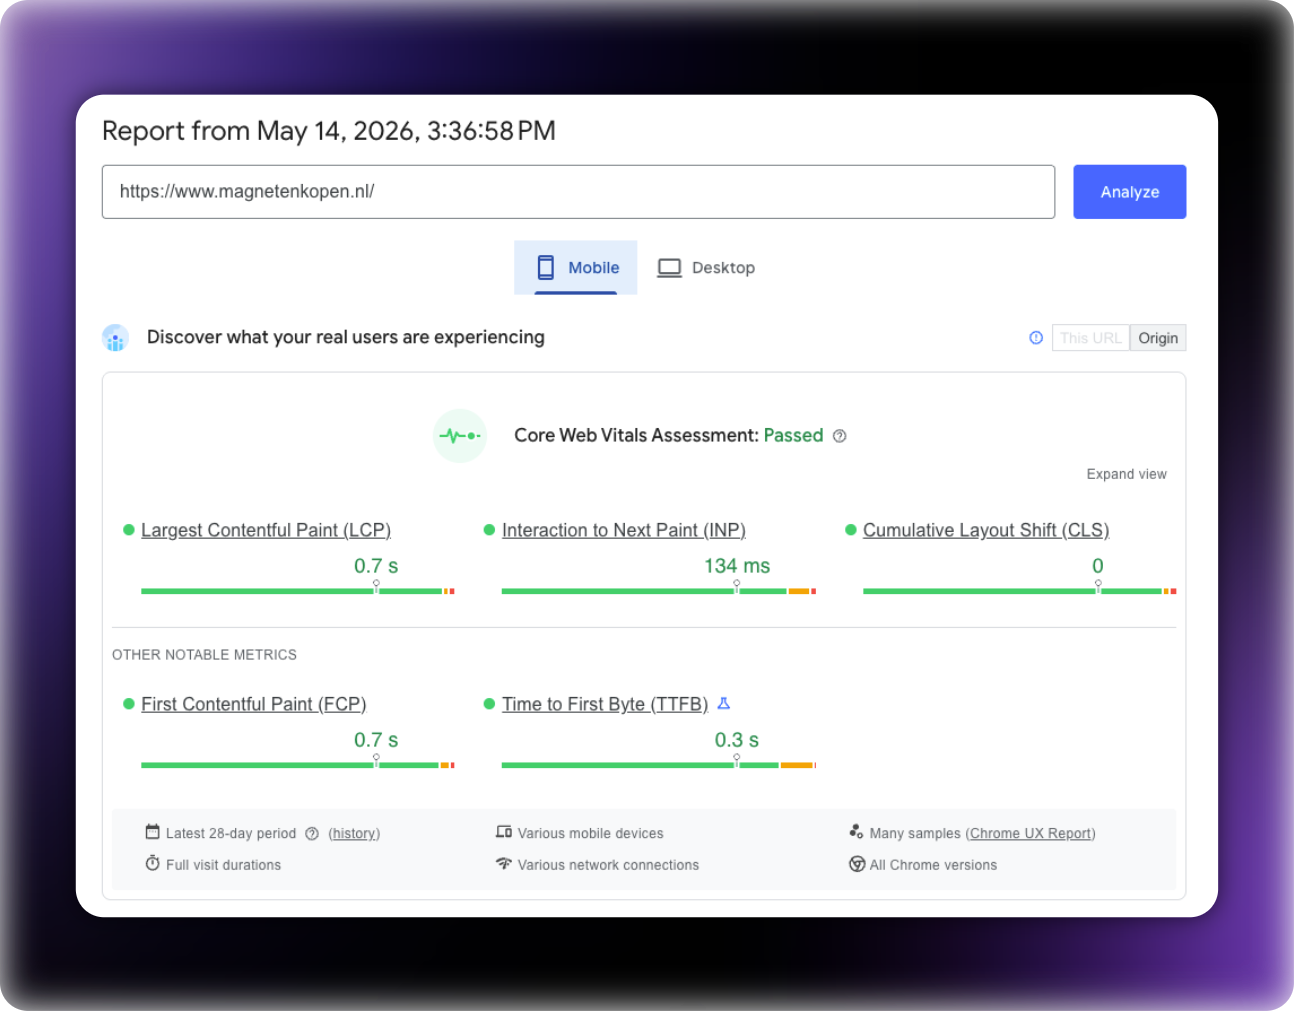
Final Core Web Vitals — PageSpeed Insights (May 14, 2026)
| Metric | Mobile | Desktop | Threshold | Status |
|---|---|---|---|---|
| LCP | 0.7 s | 1.3 s | ≤2.5 s | Passed |
| INP | 134 ms | 66 ms | ≤200 ms | Passed |
| CLS | 0 | 0.1 | ≤0.1 | Passed |
| FCP | 0.7 s | 1.2 s | ≤1.8 s | Passed |
| TTFB | 0.3 s | 1.0 s | ≤0.8 s | Improved |
Google Search Console — CWV Assessment
| Category | Before | After |
|---|---|---|
| Poor URLs | Multiple (LCP >4s flagged) | 0 |
| Needs Improvement URLs | Multiple (CLS >0.1 flagged) | 0 |
| Good URLs | 0 | 126 of 126 (100%) |
| Overall Assessment | Failed | Passed |
Cloudflare RUM Field Data (May 8, 2026)
- Page load time: 1,496 ms — down 23% from baseline
- LCP Good rate: 90% of real users
- INP Good rate: 88% of real users
- CLS Good rate: 86% of real users
Before vs. After Summary
| Metric | Before | After | Improvement |
|---|---|---|---|
| LCP (Desktop) | >4.0 s | 1.3 s | >67% reduction |
| LCP (Mobile) | ~1.5 s (p75) | 0.7 s | 53% reduction |
| TTFB (Mobile) | 1.37 s (p75) | 0.3 s | 78% reduction |
| CLS (Desktop) | >0.1 | 0.1 | At threshold |
| CLS (Mobile) | 0.12 | 0 | 100% eliminated |
| Third-party scripts | 37 | 13 | 65% reduction |
| Total scripts loaded at paint | 81 | Deferred/delayed | 75% deferred |
| CWV pass rate (all URLs) | 0% | 100% | 126/126 URLs passing |
Timeline
| Week | Phase | Key Actions |
|---|---|---|
| Week 1 | Instrumentation | Cloudflare RUM setup, baseline audit, SpeedVitals batch testing |
| Week 1–2 | CDN Deployment | Cloudflare edge caching, TTFB reduction, cache rules for WooCommerce |
| Week 2–4 | JS/Plugin Overhaul | Cookie widget replacement, review system migration, script defer/delay strategy |
| Week 4–6 | CLS Tuning & Monitoring | Layout shift remediation, element-level RUM debugging, progressive validation |
| Week 6 | Validation | GSC CWV assessment passed, all 126 URLs green |
Key Takeaways
1. RUM data beats lab data. Lighthouse scores are useful for development, but Google evaluates your site based on real users in the Chrome UX Report. We made decisions based on 75th-percentile field data, not synthetic scores from a fast connection.
2. CDN is not optional when hosting is slow. When the client can’t or won’t migrate hosting, a properly configured Cloudflare setup can cut TTFB by 78%. The key is configuring WooCommerce-aware cache rules that don’t break cart or checkout functionality.
3. Plugin replacement outperforms plugin optimization. You can defer and delay a bloated cookie widget, but it still loads eventually and still contains unnecessary code. Replacing it with a purpose-built, self-hosted alternative eliminated the problem at the source.
4. CLS requires element-level debugging. Aggregate CLS scores don’t tell you what’s shifting. Using Cloudflare’s RUM debug view, we could see exactly which elements on which page templates were causing shifts — and fix them surgically rather than guessing.
5. 75% of scripts on a typical WooCommerce site are delayable. Out of 81 scripts on the page, only 10 were needed for first paint. The rest could be safely deferred or delayed until user interaction. This single strategy had the largest impact on LCP and INP.
About
This optimization was performed as a full-service Core Web Vitals engagement. We handle the entire process — from initial audit and RUM instrumentation through implementation and ongoing monitoring — with zero disruption to the live store. No hosting migration required. No theme change. No redesign. We work with what you have and make it fast.
If your WooCommerce store is failing Core Web Vitals or you’re seeing ranking pressure from page experience signals, we can help. Every engagement starts with a detailed audit and a clear, fixed scope of work.